
I believe that Chrome Developer Tools (DevTools) knowledge is essential for any digital marketer. It opens many opportunities to learn how websites and marketing tracking work, as well as help with setting up and debugging ad & analytics pixel tracking. I will mostly refer to Chrome, while other browsers have similar tools.
If you are not familiar with Chrome DevTools, I strongly recommend reading the article or watching the video from Julian Juenemann (MeasureSchool) first. It covers some of the most common use cases and gives a very good introduction to the tool.
Here I will share some tips and marketing use cases from my experience.
Chrome DevTools: Elements panel
The Elements panel lets you inspect and edit page HTML and CSS.
Inspect HTML/CSS
Use cases:
- Learn if you can use GTM Link Click Trigger because the clickable element is a link (<a>) or not and so have to use a Click Trigger.
- Get the element class or ID for GTM selectors.
- Learn that the element you want to track is in an iframe :(
- Inspect the tags and attributes to determine the platform or plugin of the lead or contact form. For example, by seeing “wpcf7-form” class you can learn that the website uses the WordPress Contact 7 plugin, and by “hs_” – identify HubSpot forms. Knowing that you will understand how to track form submissions and which GTM listeners to look for.
Chrome DevTools: Console panel
The Console panel provides an overview of website errors and logs. It also allows you to run JavaScript code on any website yourself.
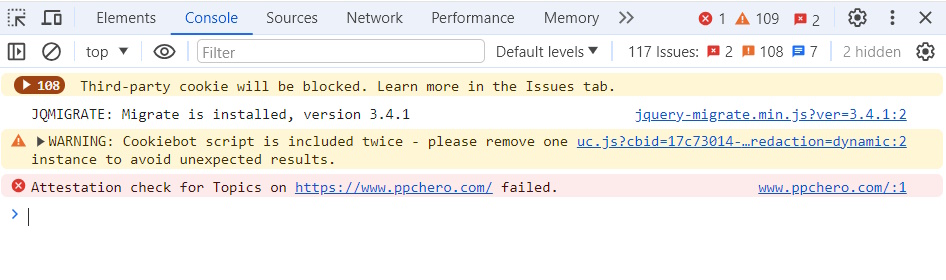
Check for Errors
Analyzing console error messages might help you to find website technical and tracking issues.
As in the example below, the cookie banner script was launched twice.
In some cases, Google Analytics 4 tracking can be blocked due to a content security policy. Check this article for more details about this issue.
Also, you can implement error event tracking in GA4 to analyze what errors occurred, how often, and on what pages. Of course, unless the cause of those errors blocks GA4 tracking as described before.
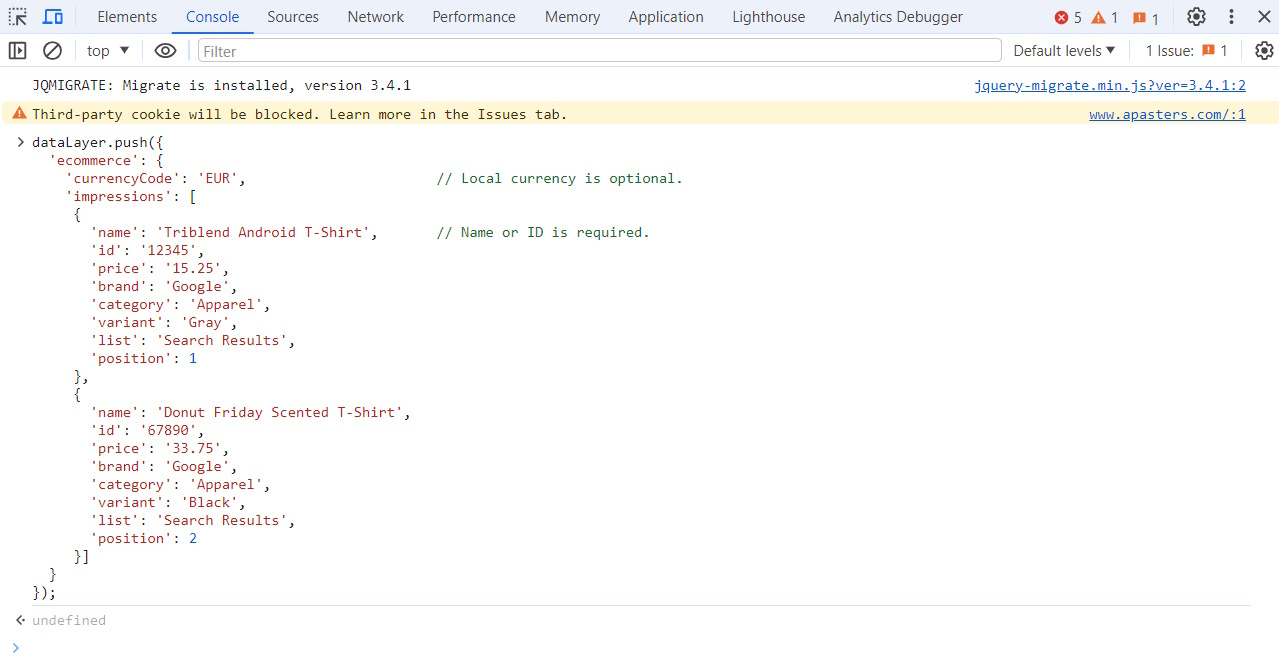
Inject JavaScript code / dataLayer events
Sometimes you might need to check the GTM setup but developers haven’t yet added the dataLayer on the website. Or the dataLayer is placed on the purchase page that is not possible to check without making payment. You can copy/paste the dataLayer event on any page and trigger the desired Tag to verify the setup. Of course, you would still need to verify the tracking for the actual purchase, but still can do some debugging with this “hack”.
Or, you can paste any JavaScript code to validate the output before using it in the Google Tag Manager and having to refresh the preview for each code version.
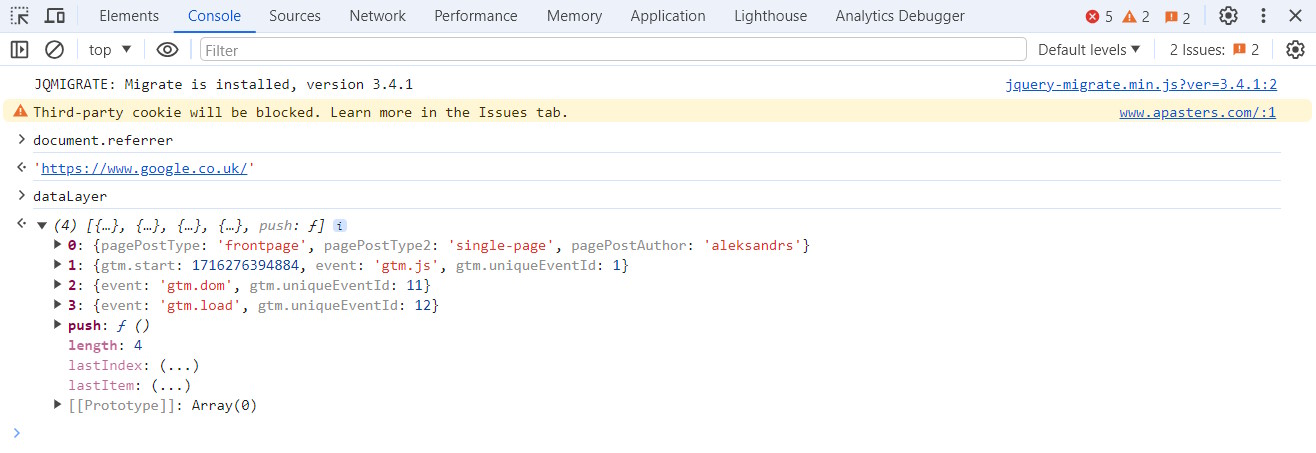
You can also get access to the global variable values in the Console panel. For example, type “document.referrer” (and press Enter to submit) for page referrer information or “dataLayer” to display dataLayer object values.
Chrome DevTools: Network panel
The Network panel allows you to see and analyze the network requests, including all the hits to various ad & analytics platforms, or server-side GTM.
Inspect hits
This is probably one of the most used Chrome DevTools feature for tracking debugging. While you can use different Chrome extensions that might provide a more convenient way to check the hits sent to various ad & analytics platforms, knowing how to find and inspect the hits in the Network tab is still valuable.
I usually use the search to find the hits I need, by typing part of the hit request, e.g. platform domain or URL path, or tracker ID. And most often go to Payload tab, where the data from the hit is formatted to key and value pairs in the table, instead of the long query, making it easy to read and find the data needed.
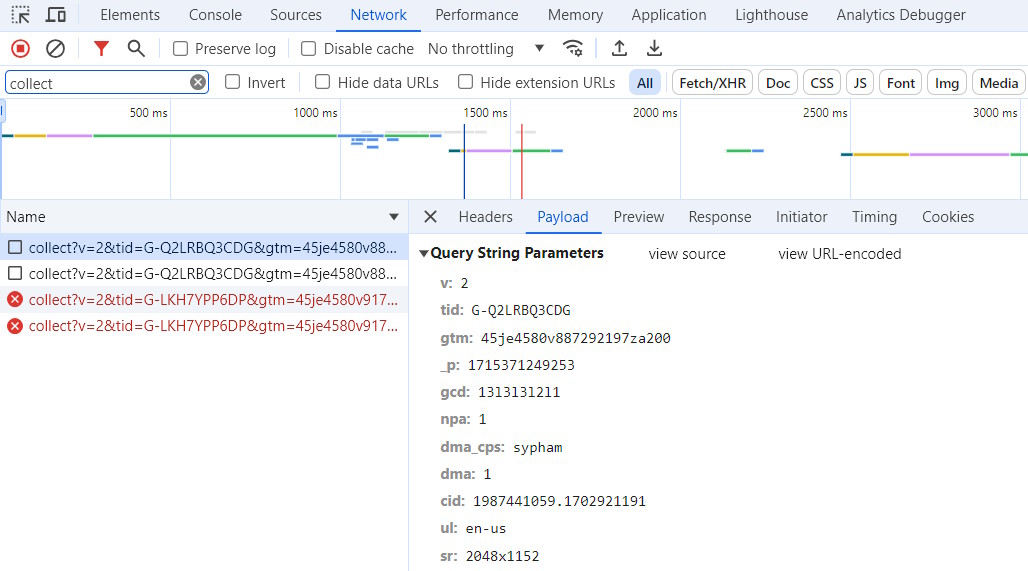
As you can also see on the screenshot, 2 GA4 hits had errors. This is also helpful to know if the hits were sent successfully or not.
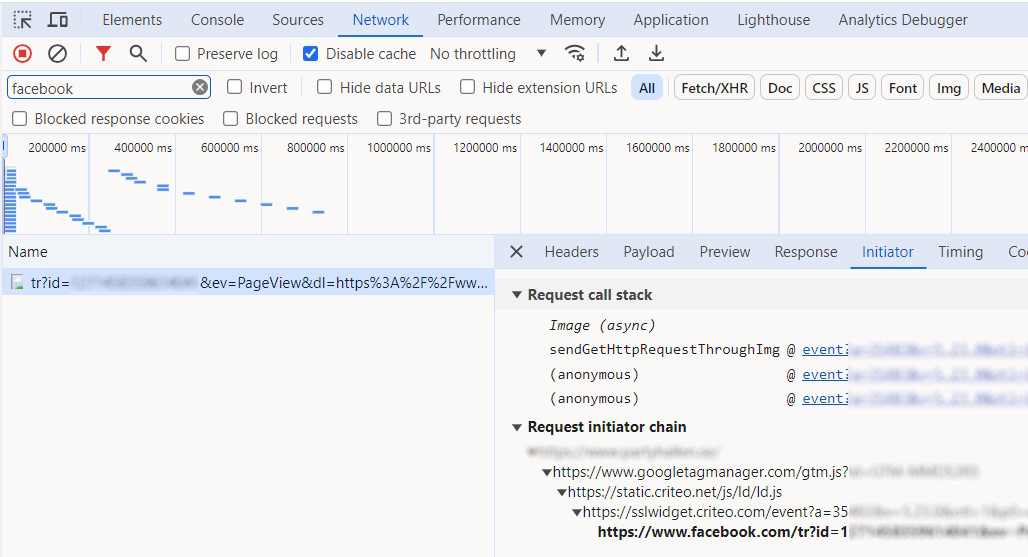
Find the initiator of the hit
Find the scripts that initiated the request. Example: Facebook pixel was loaded on the page, while not found in the GTM or page source code. After checking the initiator, I’ve found that it was loaded from the Criteo tracking, loaded from the GTM.
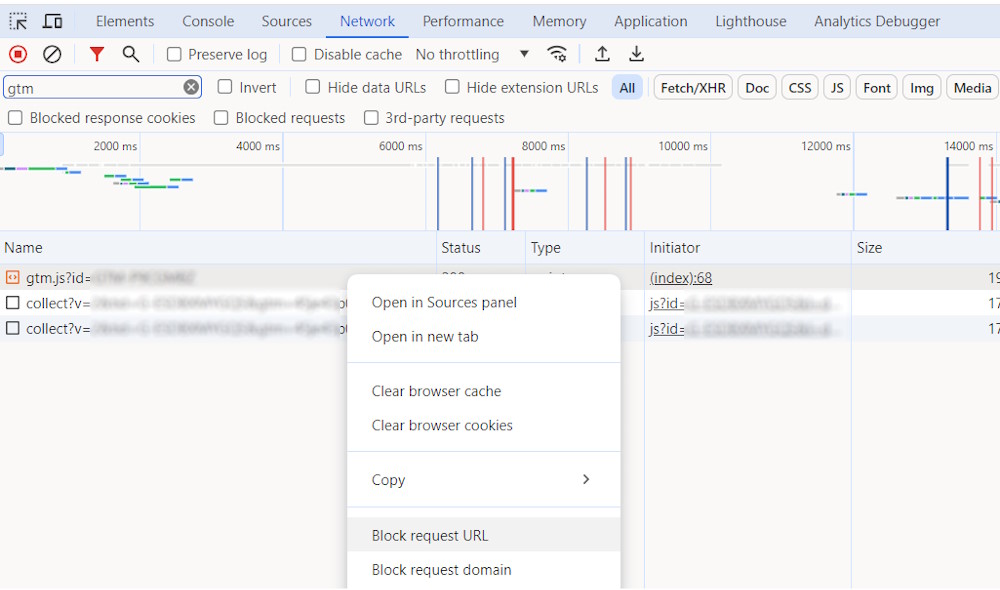
Block certain hits or scripts
If you think certain scripts are causing tracking issues, you can block them in your browser to validate this hypothesis before asking developers to remove them from the code.
Example: A website had 2 consent management platform scripts installed with different settings that led to tracking issues. By blocking one in the browser and seeing the impact, I could confirm my initial finding.
Chrome DevTools: Application panel
The Application panel lets you inspect cookies and local storage used by the website.
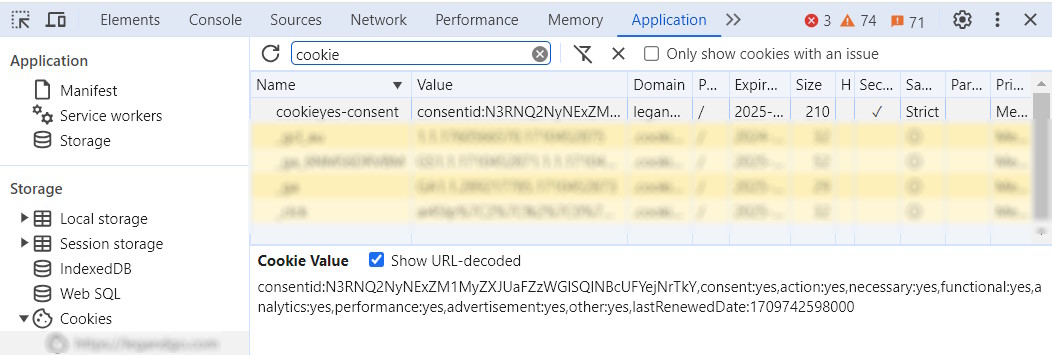
View and delete cookies
The application tab is especially useful when working with Consent Mode setup and ensuring GDPR/ePrivacy compliance in general. You can check if and which cookies were set, find how consent settings are stored to create the GTM cookie variable and custom JavaScript variable to determine analytics and ad storage settings. And you can also remove consent banner cookies and reload the page, to see the consent banner again.
Bonus tip
Make full-page screenshots with Chrome DevTools – this is really awesome!